- Do you need to create reports or executive dashboards that are segmented by specific projects?
- Do you need to view all of the projects for a specific client you work with?
- Do you want to see what type of work your team spends most of their time on?
- Do you want to analyze resource workload by different teams in your workspace?
If you answered yes to any of the questions above, you’ll want to start thinking about how set up your project data now. This is the final major step of setting up your new workspace, so that you can include these data points in your reports, Dashboards and project planning.
Custom Fields
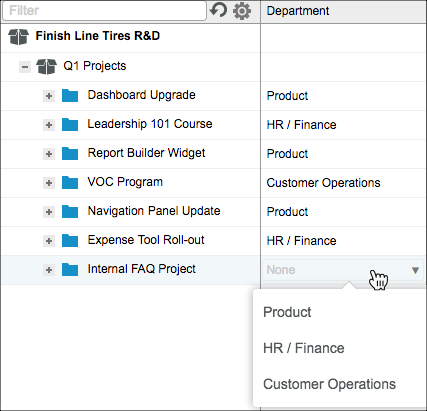
Custom fields can be configured on projects or tasks. Custom field types include: pick list, free text, date, numeric, and currency. Here are some common ways Custom Fields are used:
To get a side-by-side view of the Department that owns each project using a pick-list Custom Field:
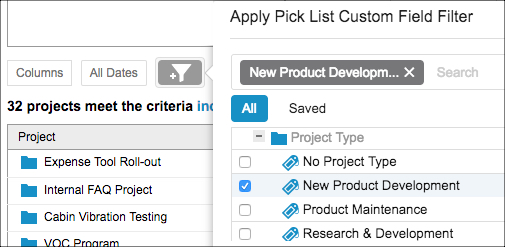
To filter reports and Dashboards by pick-list fields such as Project Type:
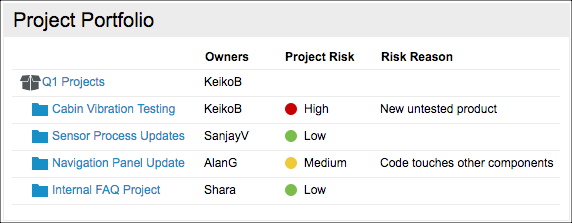
Create an Executive Dashboard with a custom field for Project Risk (with a risk color). This also includes a free-text custom field for Risk Reason:
Activities
If you want insight into what type of work your team members spend their time on, then you should set up Activities.
You can create Activity names to represent the major segments of work across teams. And if you work with clients, you can also mark specific Activities billable or non-billable.
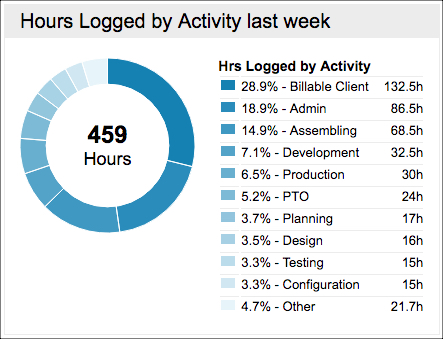
Here is an example of a donut chart in a Dashboard that visualizes the amount of time team members spent on various Activities over the last week.
Clients
If you are delivering your projects to an internal or external Client, you can populate the Client field within the Project to show this information in reports and Dashboards.
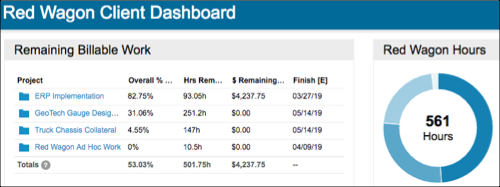
For example, here is a Dashboard that is filtered to all projects for a specific Client. You can share this dashboard with others, such as the Account Manager, or the client themselves:
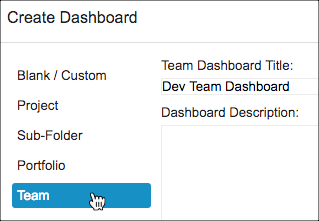
Teams
The Teams feature allows you to assign workspace members to a Team so that you can easily filter or report on all of the members within that team, rather than selecting individuals.
For example, a manager could create a Dashboard to view work by his Team:
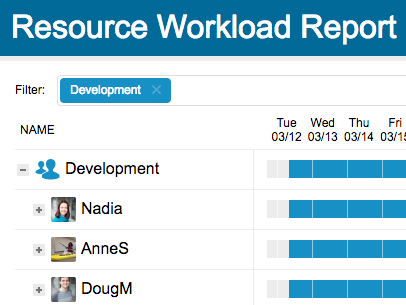
You can also segment resource workload reports by filtering to a specific team:
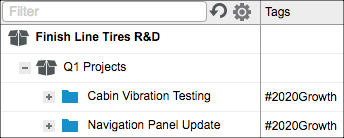
Tags
Tags are a free-text value that can be assigned to any type of plan-item. Unlike Custom Fields, which are limited to projects or tasks, you can assign a Tag to packages, projects, sub-folders, etc.
Tags are beneficial for assigning a common theme(s) to many different items, and then being able to search by that tag or filter reports and Dashboards by that tag.
Here is an example finding projects tagged with a company’s strategic initiative labeled “2020 Growth”: